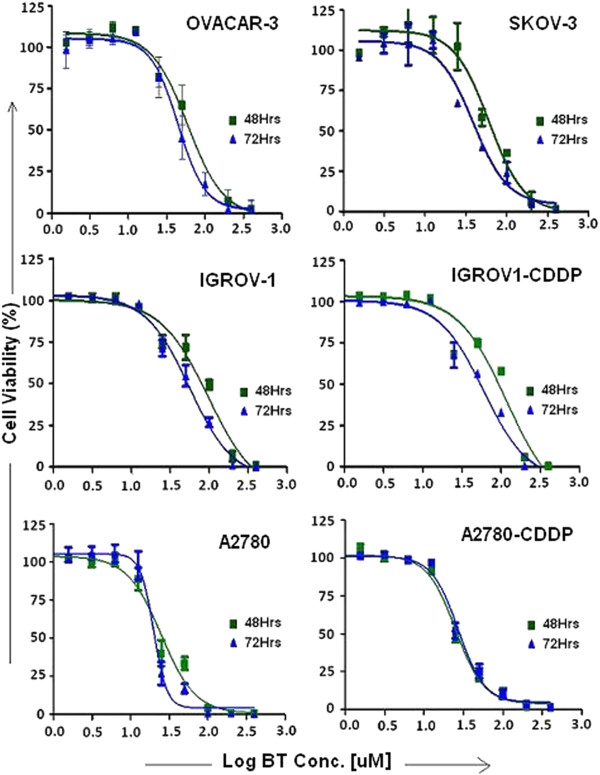
Figure 1.

Bithionol dose response curves. Cytotoxic effects of BT on a panel of ovarian cancer cell lines with varying cisplatin sensitivities. Cells were treated with different concentrations of BT for 48 or 72 hrs. Cell viability was determined by PrestoBlue Cell Viability Reagent as described in Materials and Methods. Control cells (vehicle treated) were considered as 100% viable against which treated cells were compared. Experiments were performed in triplicate. Data was expressed as mean ± SD of triplicate experiments. Dose response curves to calculate IC50 values were plotted using Graph Pad Prism Software.
