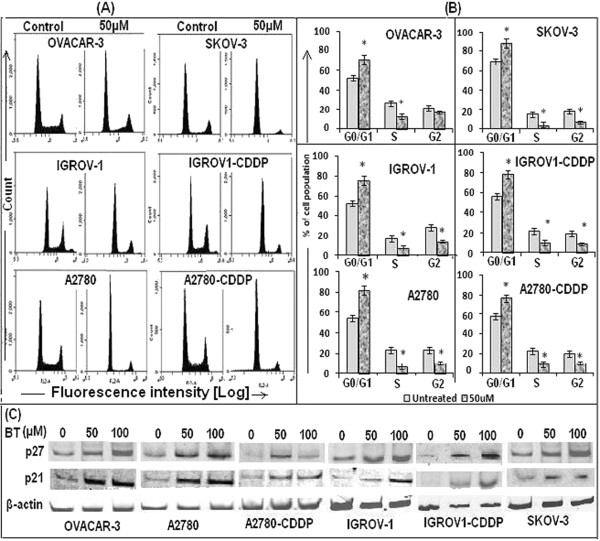
Figure 5.

Effect of BT on cell cycle progression of ovarian cancer cell lines. (A) Cell cycle analysis was carried out by flow cytometry. Cells were treated with 50 μM BT for 24 hrs. At the end of the incubation period, cells were collected, fixed and stained with 50 μg/mL of propidium iodide and 100 μg/mL of RNase for 30 min at 37°C in the dark. Data was acquired on a BD Accuri C6 flow cytometer and analyzed. Twenty thousand events were analyzed for each sample. Appropriate gating was used to select standardized cell population. (B) Graphical representation of cell cycles analysis by FACS. Data was expressed as mean ± SD of triplicate experiments. *p < 0.05, as compared to untreated control, students’ t test. (C) Expression of cyclin-dependent kinase inhibitors such as p27Kip1 and p21Cip1 in BT treated cell lines, as analyzed by western blotting of cellular lysates using appropriate primary and secondary antibodies. Ovarian cancer cell lines were treated with BT at 50 μM or 100 μM for 24 hrs.
