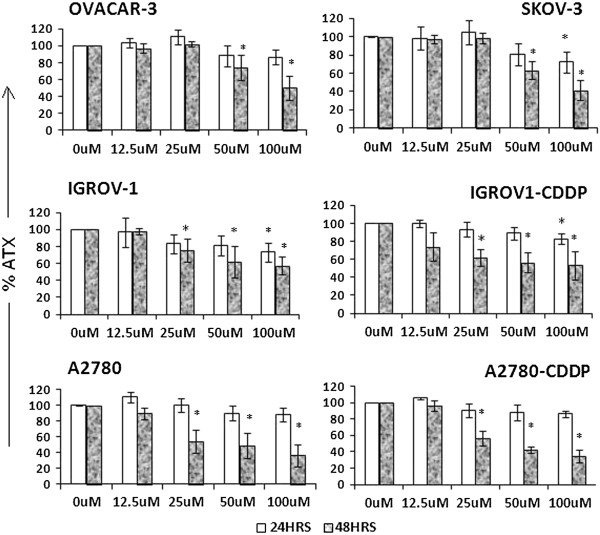
Figure 8.

Effect of BT on ATX secretion in ovarian cancer cell lines. Cells were treated with BT at different concentrations for 24 and 48 hrs. At the end of the treatment, ATX was measured from culture media by a colorimetric assay using p-nitrophenylphosphonate (pNppp) as substrate. The ATX concentration is normalized against cell number. The percent of ATX inhibition of treated cells was calculated against untreated cells. Experiments were performed in triplicate. Data was expressed as mean ± SD of triplicate experiments. *p < 0.05 as compared to control; **p < 0.01 as compared to control.
