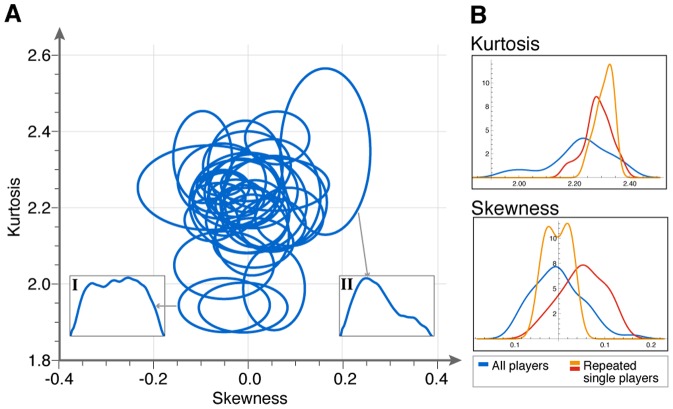
Figure 2. Players show individual signature in the shapes of their segment velocity traces.
(A) The motion of each player while playing as a leader is represented by an ellipse, which represents one standard deviation around the mean of all segments by that player in one game (between 47 to 392 segments/game, median = 170 segments/game). Insets are examples of velocity segments. (B) The distribution of different players' mean kurtosis and skewness values as leaders (blue), and of two expert players who played multiple games (16 and 8 games, red and orange curves).

