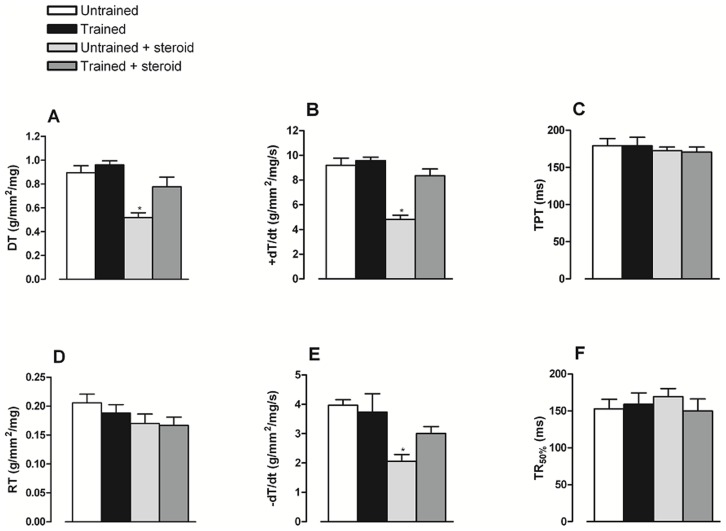
Figure 2. Systolic and diastolic parameters.
Values are expressed as the mean ± SEM of developed tension (DT, Panel A), maximum rate of tension development (+dT/dt, Panel B), time to peak tension (TPT, Panel C), rest tension (RT, Panel D), maximum rate of tension decline (−dT/dt, Panel E) and (TR50%, Panel F). * represents significant differences (P<0.05) respect to other groups by one-way ANOVA–Tukey test.

