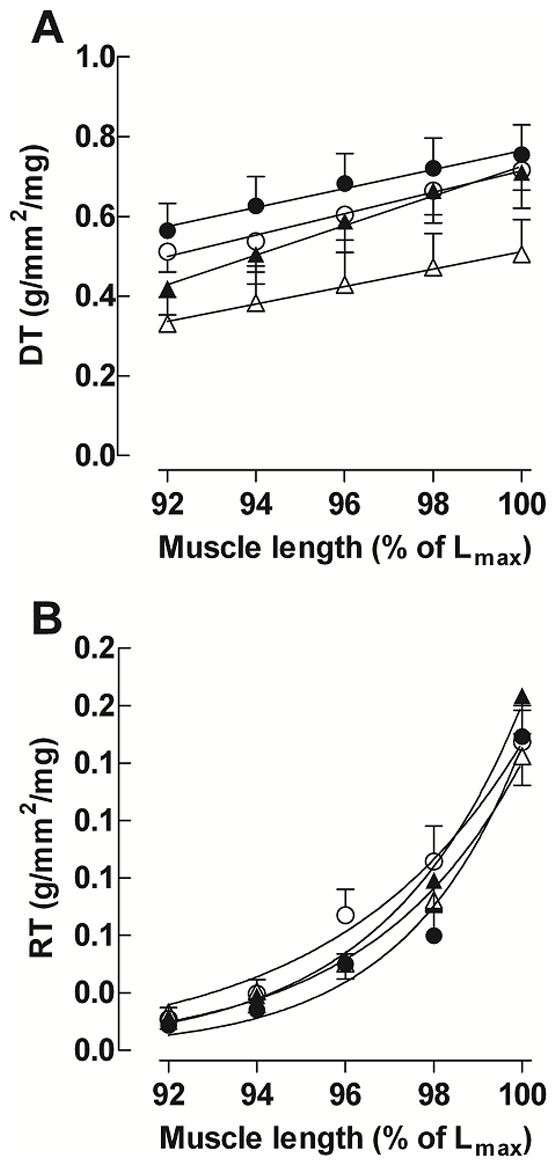
Figure 3. Frank-Starling relationship.

Values are expressed as the mean ± SEM of left ventricular papillary muscle developed (A) and resting (B) length-tension curves obtained from untrained (○), trained (•), untrained+steroid (▵) and trained plus steroid (▴) rats. A: straight lines were fitted to the developed length-tension relationships using linear regression analysis. B: the resting tension-length curves for the four groups were fitted to mono-exponential non-linear relationships.
