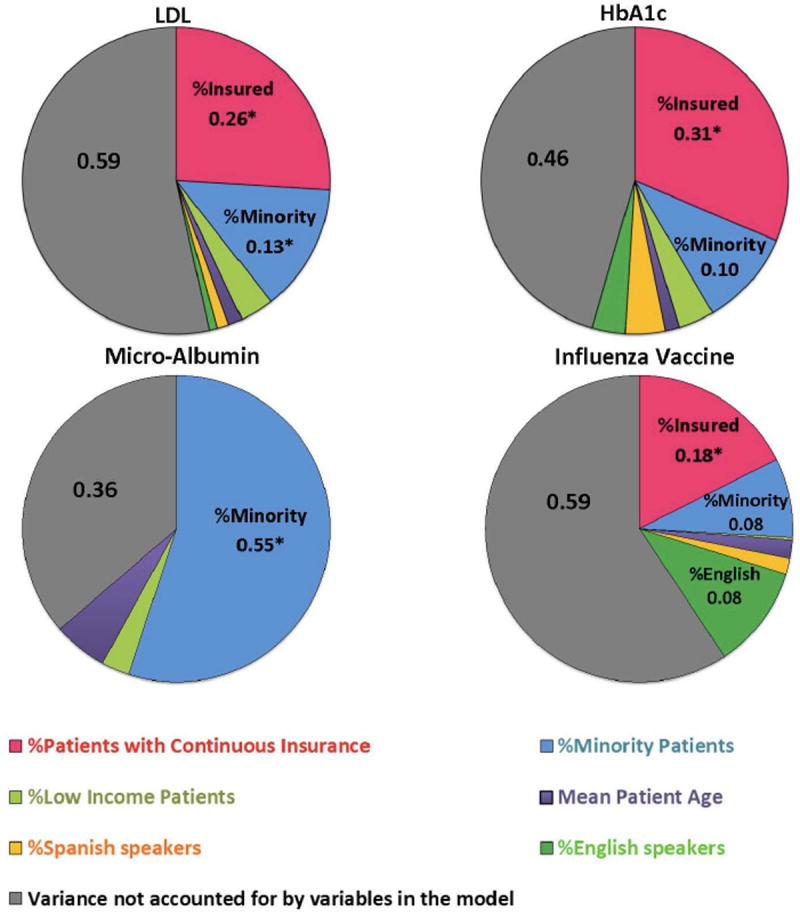
Figure 2. Proportion of variability in clinic-level percent of patients provided diabetes preventive services accounted for by clinic-level patient panel characteristics.

Note. The percent variability associated with Clinic Patient Panel characteristics was determined from the change in r2 when the variable was added to a model already containing the variables with stronger association with delivery of the service. The variable order was determined through stepwise selection based on the variable addition resulting in the maximum change in r2. The proportion of clinic variability in delivery of a service that is not explained by a model including all patient characteristics in this study is shown in gray.
*p<0.05.
