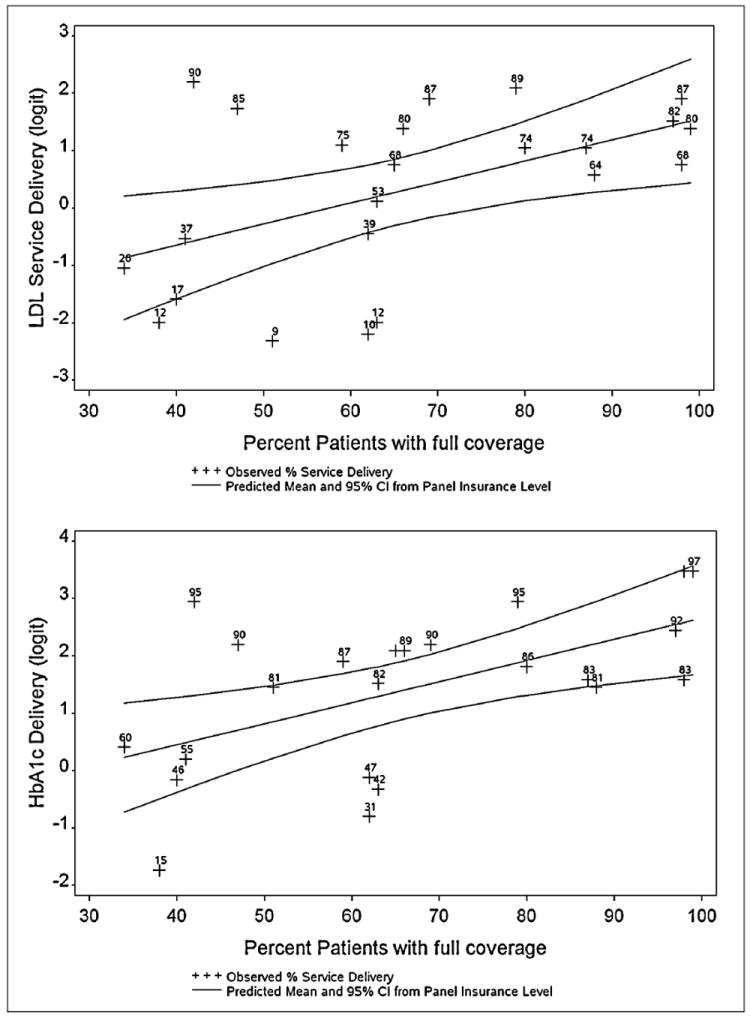
Figure 3. Observed rates of diabetes preventive services by clinic, as compared to rates predicted by the percentage of each clinic’s patient panel with full insurance coverage.

Note. Predicted values and 95% confidence intervals were estimated from regression models of delivery of preventive service rates on the percent of patient panel with full insurance coverage. The model used logit transformed rates to keep the predicted rates bounded between 0 and 100%. Graphed values are the logit transformed values (y axis) of observed values labeled with the actual rates (%) to facilitate interpretation.
