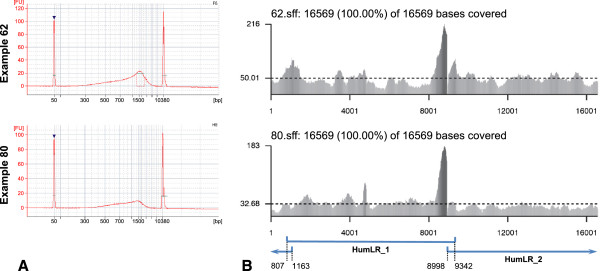
Figure 2.

Example fragmentation profiles and coverage plots. Example fragmentation profiles and coverage plots are shown for two mitochondrial genomes (examples 62 and 80). A. These Bioanalyzer profiles (from a DNA 7500 chip) show pooled long-range PCR products after digestion with NEBNext dsDNA Fragmentase (10 min at 37°C). The x-axis shows the inferred size of the DNA fragments based on the two internal markers of known size (the peaks at 50 and 10,380 bp). The y-axis shows the amount of DNA present based on fluorescence units. Both example digestion profiles show fragments between distributed between ~300 bp and ~5 kb in length, with the distribution skewed towards smaller fragments. These profiles show fragments in the ideal size range for 454 sequencing. The difference in yields between the two samples is probably due to different recovery efficiencies in the preceding AMPure XP purification step. Screen captures are taken from the 2100 Expert software (Agilent). B. These coverage plots for two mitochondrial genomes were generated using the software described in this paper. The x-axis shows the nucleotide positions based on the revised Cambridge Reference Sequence (rCRS). The y-axis shows coverage depth. The horizontal dashed line indicates mean coverage for that genome. On the left of each heading line is the individual name (e.g. 62.sff or 80.sff); the following number (here, 16569) is the number of positions that were covered by at least 1 read, and the final number (here, also 16569) is the length of the reference sequence. Note the large peak from 8,000–9,000 bp, which is discussed in the main text. The blue lines represent the corresponding long-range PCR products and the associated numbers the positions of the ends of those products (see Table 1). The data used to generated these coverage plots is available in Additional file 6.
