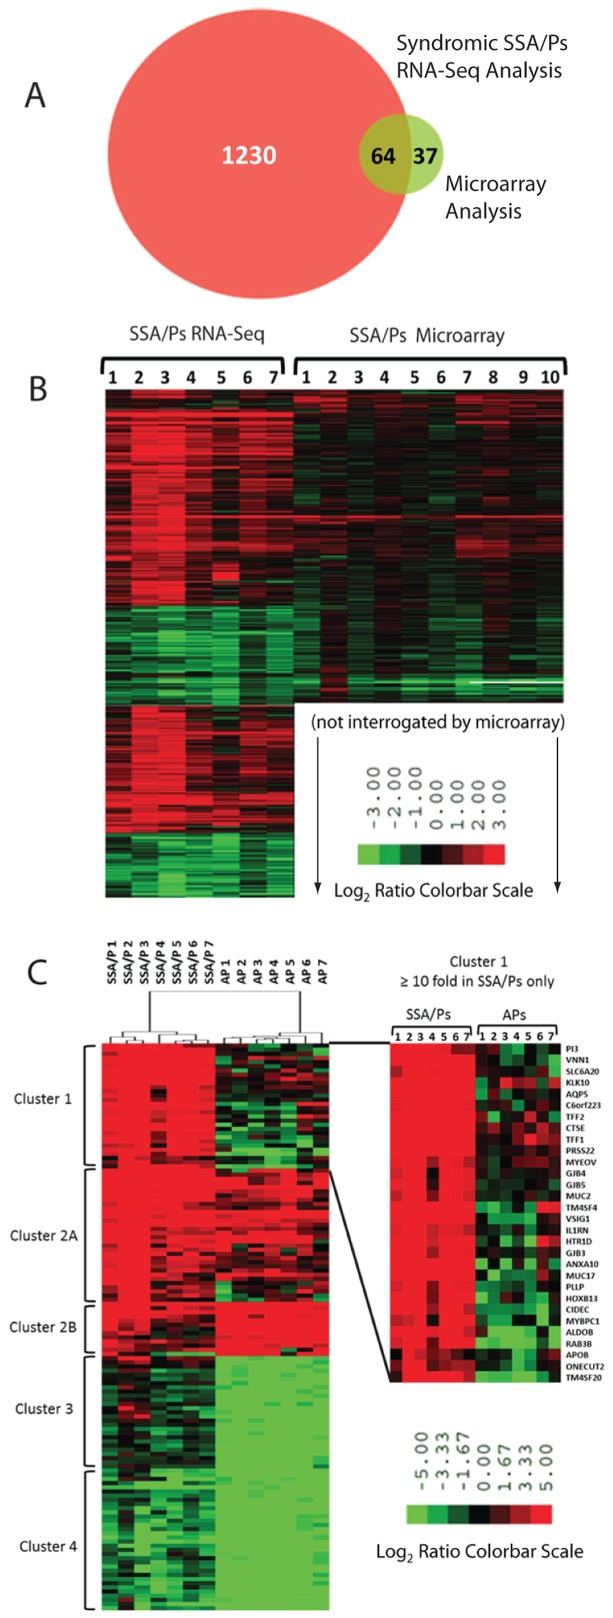
Figure 2. Differentially expressed genes in sessile serrated adenoma/polyps (SSA/Ps) by RNA sequencing (RNA-seq) and microarray analyses.
Panel A. RNA-seq analysis identified 1294 genes (875 increased, 419 decreased) that were significantly differentially expressed (fold change ≥1.5, FDR<0.05) in SSA/Ps as compared to control colon biopsies. Differentially expressed genes in SSA/Ps that were found by RNA-seq analysis (red) and those found in a microarray study (green; 101 total, 59 increased, 42 decreased) are shown in the Venn diagram (23). Panel B. Hierarchical clustering of the differentially expressed genes in Panel A. Note: only 782 genes could be compared in the hierarchical clustering analysis because fewer genes were interrogated in the microarray analysis. Panel C. Hierarchical clustering of differentially expressed genes in SSA/Ps identified by RNA-seq analysis and in adenomatous polyps (APs) identified by microarray analysis (24). 136 genes (75 increased, 61 decreased) with a fold change ≥10 and FDR of <0.05 from both datasets were compared. Four distinct clusters are shown, cluster 1 represents genes increased in only SSA/Ps, cluster 2 represents genes increased in both SSA/Ps and APs, cluster 3 represents genes decreased only in APs, and cluster 4 represents genes decreased in both SSA/Ps and APs. Note: the full range of fold change is not reflected in color bar scale, the maximum fold change in RNA-seq analysis was 582-fold (MUC5AC) in SSA/Ps and 208-fold (GCG) in APs by microarray analysis.

