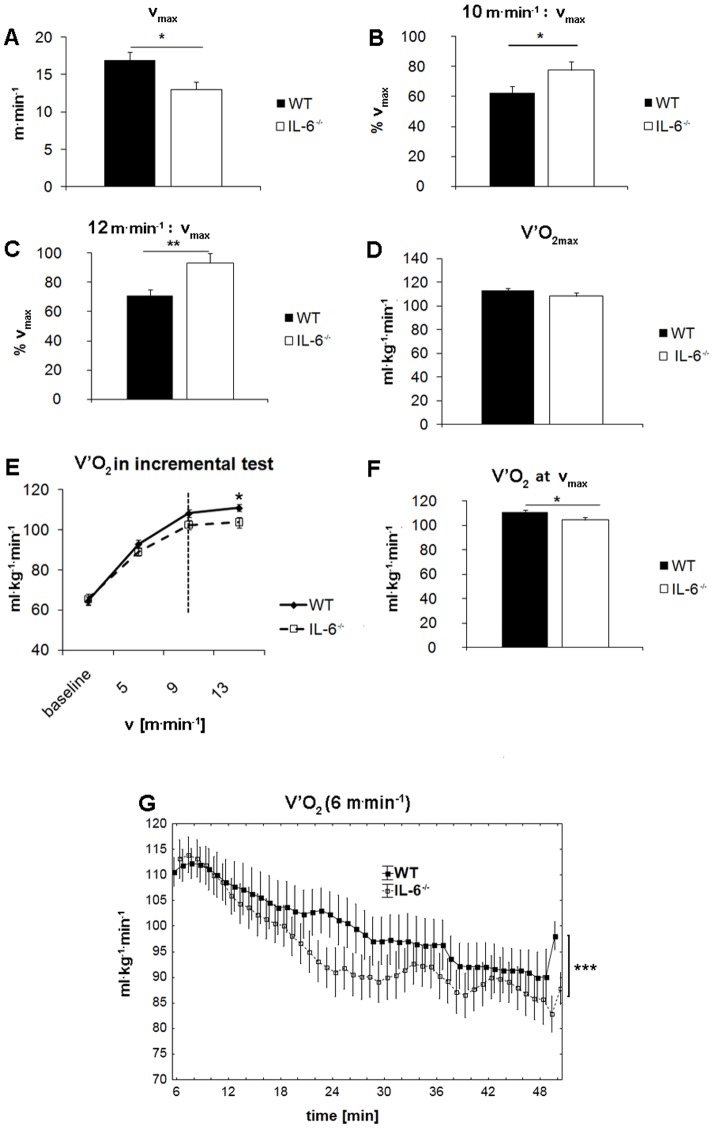
Figure 1. Running performance during maximal incremental exercise test in WT and IL-6−/− mice.
Maximal velocity (vmax) (A), running intensity at 10 m.min−1 (B) and at 12 m.min−1 (C), maximal oxygen consumption (V′O2max) (D), oxygen consumption during an incremental test with increasing speeds (E), oxygen consumption at maximal velocity (V′O2 at vmax) (F) and oxygen consumption during 1-hour run at submaximal velocity of 6 m.min−1 (G). For determination of vmax (A), V′O2max (D) and V′O2 at vmax (F), WT control and IL-6−/− mice were run at an inclination of 0° with the increasing speed and their oxygen consumption (V′O2) was registered (E) whereas for measurement of V′O2 during sub-maximal exercise, mice were run at velocity of 6 m.min−1 for 1 h (G). Data are presented as the mean ± SEM. The symbols * denote values significantly different: *(P<0.05), **(P<0.01), ***(P<0.001). Statistical analysis was performed in Statistica 10 (G; ANCOVA, n = 6, P<0.0001) or GraphPad Prism5 (two-sided T-test; n = 22-11).

