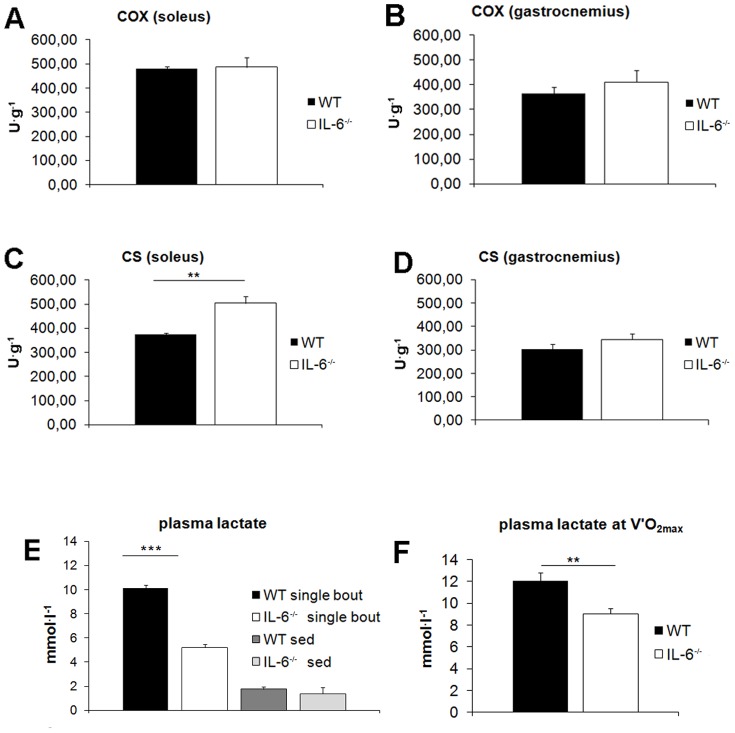
Figure 4. Post-exercise plasma lactate and COX, CS activities in skeletal muscles in WT and IL-6−/− mice.
COX and CS activities in soleus (A, C) and gastrocnemius (B, D) skeletal muscles were measured in lysates from non-exercising WT control mice and IL-6−/− mice. Post-exercise plasma lactate concentration (E) was assessed both in non-exercising mice (WT at rest and IL-6−/− at rest) as well as in animals subjected to single bout of exercise (1-hour run at 8 m.min−1). (F) Plasma lactate concentration at V′O2max during maximal incremental running test until exhaustion in WT mice and IL-6−/− mice. Data are presented as the mean ± SEM and symbols * denote values significantly different: **(P<0.01), ***(P<0.001). Statistical analysis was performed in GraphPad Prism5 (two-sided T-test, n = 7–11).

