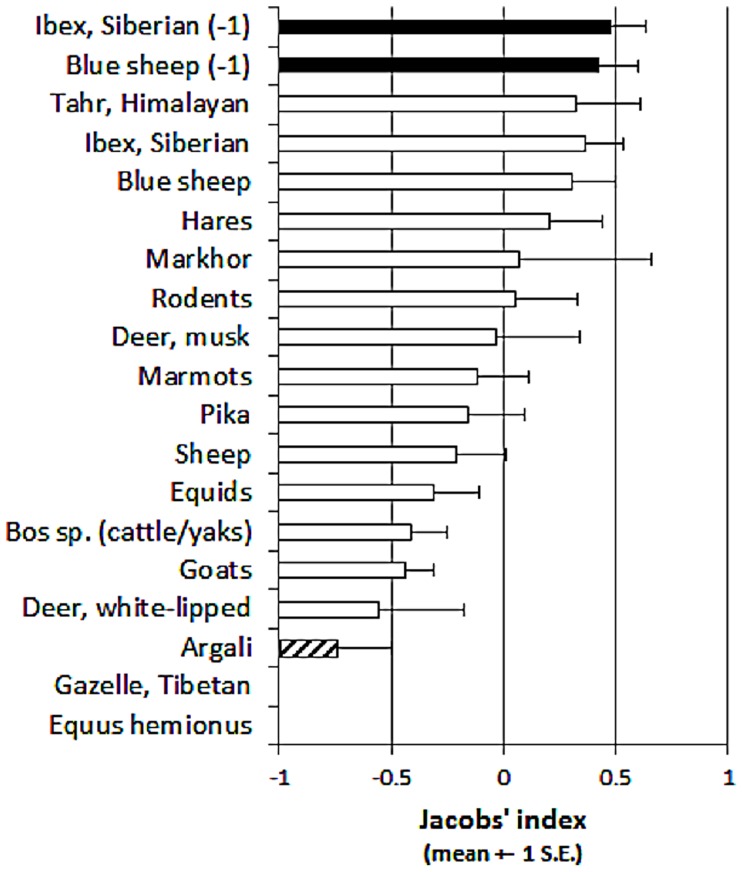
Figure 8. Mean Jacobs' index values (±1 S.E.) for prey species of the snow leopard at two or more sites.
Black illustrates significantly preferred prey, open bars represent species killed in proportion to their availability and stippled bars (or no bar) indicate significantly avoided prey species. As described in the text, we analysed the data of Siberian ibex and blue sheep twice to remove one outlying result for each.

