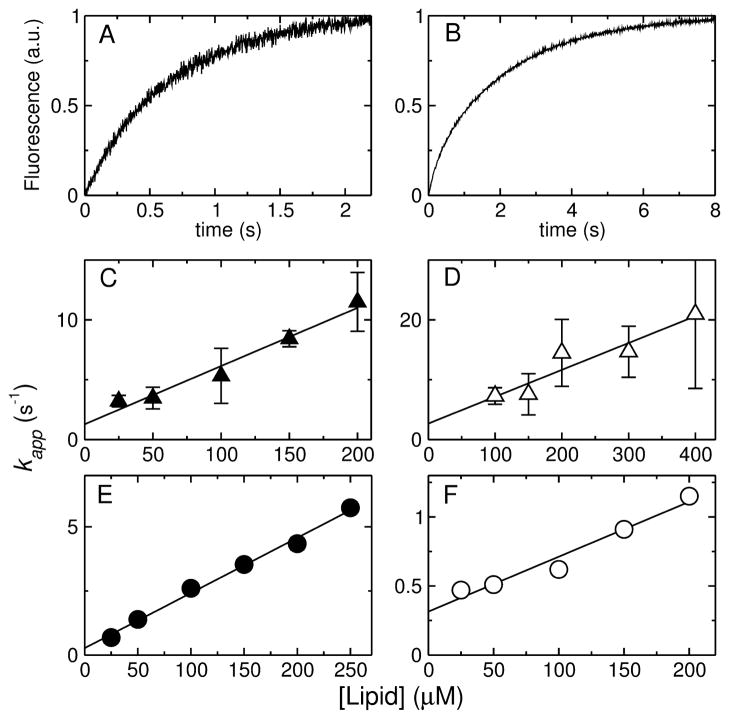
Figure 6.
Examples of binding kinetics curves for (A) Rh-TP10W and (B) Rh-DL-1a, with 1 μM peptide and 50 μM lipid concentrations, and plots of kapp as a function of lipid concentration for (C) Ac-TP10W, (D) Ac-DL-1a, (E) Rh-TP10W, and (F) Rh-DL-1a. In (E) and (F) the error bars are inside the points.

