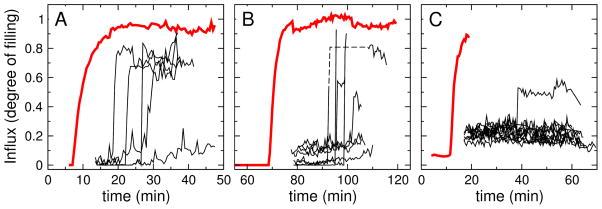
Figure 7.
Time traces of CF flux into inner GUVs (black) compared with the influx into the outer GUV (red). (A) Rh-TP10W, (B) Rh-DL-1, and (C) CE-2. The fluorescence intensity inside the vesicles is measured relative to an area outside the vesicles. The dashed line in (B) traces a vesicle whose track was temporarily lost, as it drifted out of focus.

