
Fig. 5.
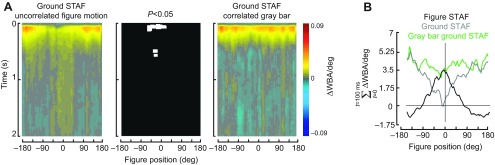
Control STAF in which the uncorrelated figure has been replaced with an equal-sized uniform gray patch embedded in the ground pattern. STAFs were measured in the same manner as in Fig. 4. (A) Left: ground STAF parameterized for the azimuthal position of a 30 deg figure moving on a separate m-sequence. Note the prominent response suppression on visual midline. Right: ground STAF in which a 30 deg region of the random black-and-white pattern has been replaced with a gray patch of equal mean luminance (Fig. 1Biii). The center plot shows the regions of significant difference between the two ground STAFs. White indicates statistical significance (P<0.05, paired t-test after Benjamini–Hochberg false discovery rate correction). (B) Azimuthal profile of the STAFs summed over the first 100 ms.