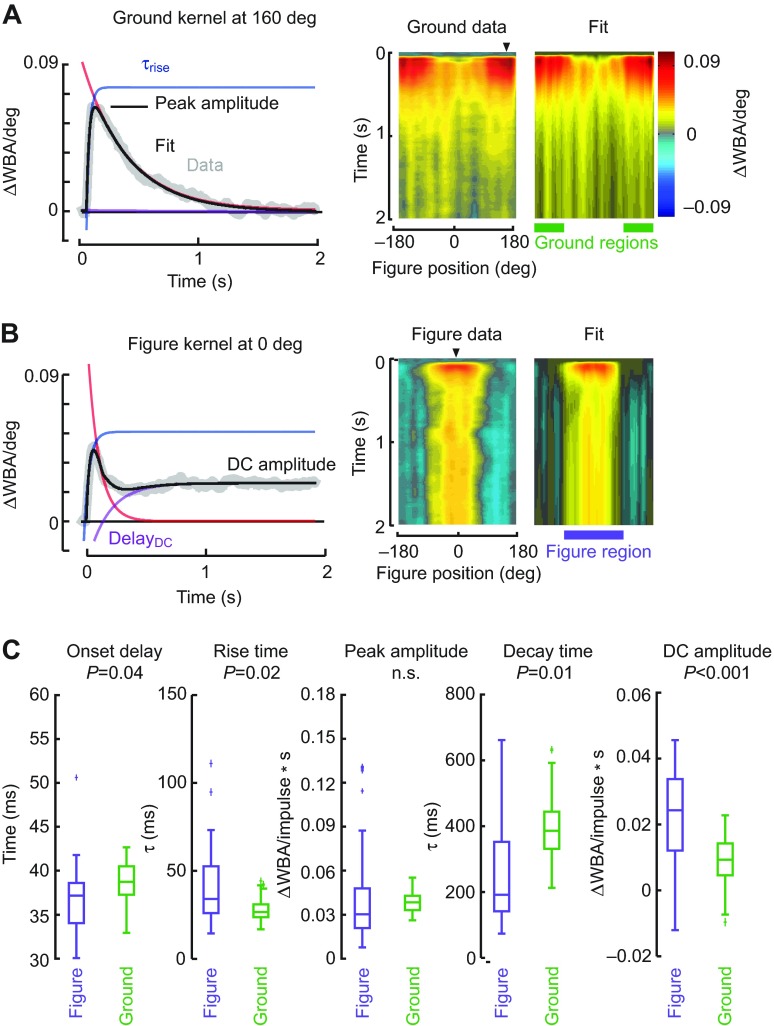
Fig. 7.
Analysis of STAF temporal dynamics. (A) Left: The ground kernel measured at 157 deg was fit with a model based on the difference of two exponentials (see Materials and methods for details). Right: the fitted ground responses at each azimuthal location are compiled within a heat map in the same manner as the data STAF to enable visual comparison. Arrowheads on the right-hand panels indicate the azimuthal location of the bar for the data plotted in the left-hand panels. (B) Fits for the figure response measured at 0 deg (left), and for all azimuthal positions complied into a STAF (right). (C) Parameter values are compared between the figure and ground responses for kernels occurring where the figure responses were strongest (at 0 deg azimuth, indicated by arrowhead in B) and where the ground responses were strongest (at 157 deg azimuth, indicated by the arrowhead in A), respectively. Box-and-whisker plots indicate the median or second quartile, first and third quartiles (box), and 1.5 times the upper and lower quartile range (whiskers). Outliers are marked with plus signs. P-values are reported for the unpaired t-test and Bonferroni correction. The spatial regions of maximum ground response and maximum figure response, from which the parameters are drawn spatially, are indicated with green and purple bars, respectively.

