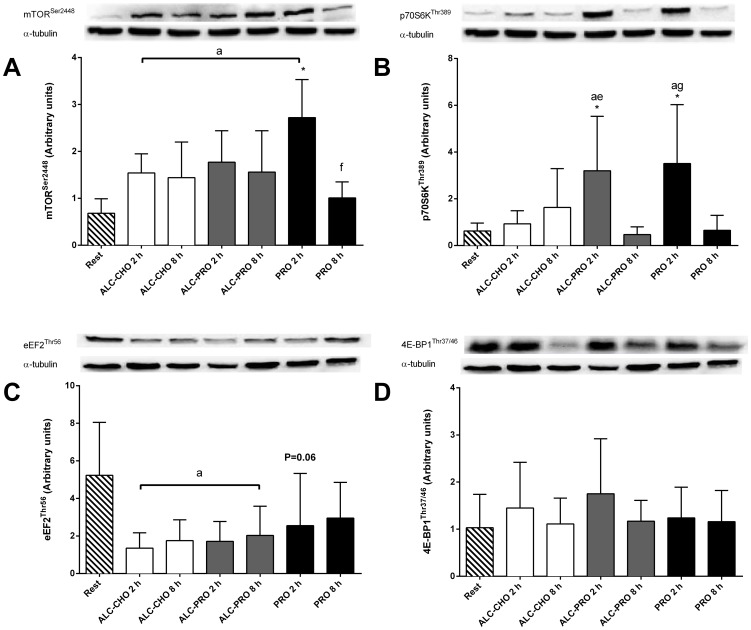
Figure 5. mTORSer2448 (A), p70S6KThr389 (B), eEF2Thr56 (C), 4E-BP1Thr37/46 (D) phosphorylation at rest and following a single bout of concurrent training.
Images are representative blots for each protein from the same subject and values are expressed relative to α-tubulin and presented in arbitary units. Data were analysed using a 2-way ANOVA with repeated measures with Student-Newman-Keuls post hoc analysis. Values are mean ± SD. Significant effect of time (P<0.01) and interaction (P = 0.02) but not treatment (P = 0.22) for (A); time (P<0.01) and interaction (P = 0.02) but not treatment (P = 0.46) for (B); time (P<0.01) but not treatment (P = 0.14) or interaction (P = 0.56) for (C); no treatment (P = 0.86), time (P = 0.24), or interaction (P = 0.77) effects for (D). Significantly different (P<0.05) vs. (a) rest, (e) ACL-PRO 8 h, (f) PRO 2 h, (g) PRO 8 h, and (*) 2 h between treatments.

