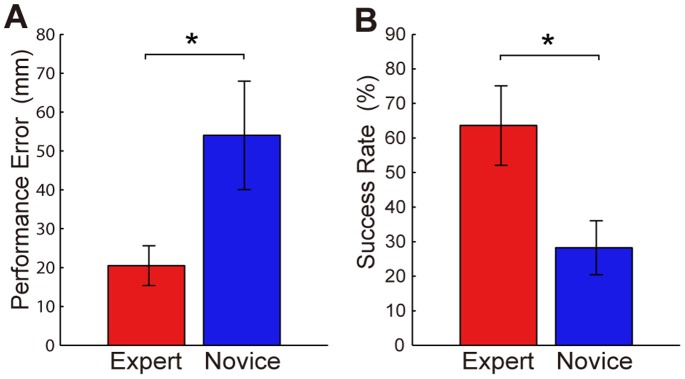
Figure 3. Mean performance error and success rate.

The performance error (A) and success rate (B) were averaged per group and are indicated with bars. The error bars denote standard deviations between subjects. *: p<0.05.

The performance error (A) and success rate (B) were averaged per group and are indicated with bars. The error bars denote standard deviations between subjects. *: p<0.05.