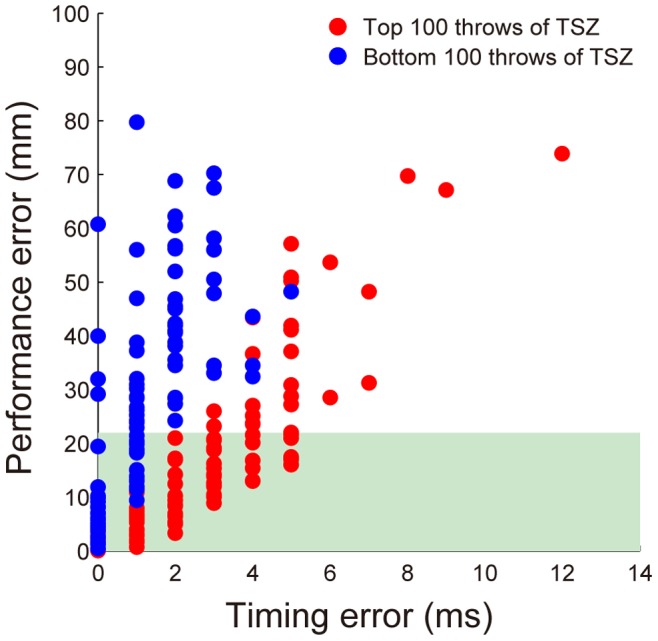
Figure 7. Sensitivity of timing error to performance error: Difference between lengths of time in success zone.

Relationship between timing error and performance error of all throws from all experts. The red dots indicate the top 100 throws, which have longer TSZs, and the blue dots indicate the bottom 100 throws.
