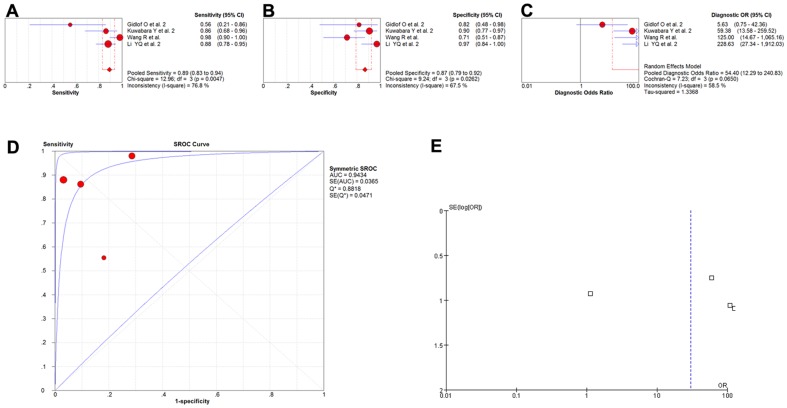
Figure 5. The sensitivity, specificity, diagnostic OR, SROC curve with AUC and funnel plot for miR-133a levels of 4 studies in the diagnosis of myocardial infarction.
(A) Sensitivity. (B) Specificity. (C) Diagnostic OR. (D) SROC curve with AUC. (E) Funnel plot. Df, degree of freedom; OR, odds ratio; SROC, summary receiver operator characteristics; AUC, area under the curve; SE, standard error; Q*, Q index. Balls, estimated respectively the sensitivity, specificity, diagnostic OR, AUC; Bars, 95% confidence intervals (CIs); Width of diamonds, pooled CIs. The size of each ball is proportional to the weight of each study in the meta-analysis. The SROC show all values of AUC and the area between the upper left and lower right curves represent the CIs of AUC for total miRNA levels. Values that cross the borders are not shown in these figures. Boxes in the funnel plot indicated the studies included in this meta- analysis.

