Figure 5.

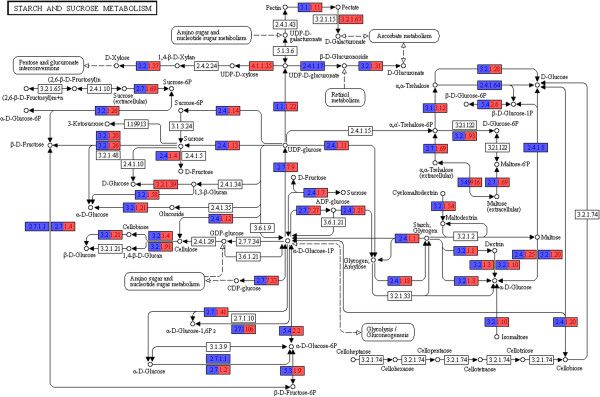
KEGG sub-pathway for starch and sucrose metabolism. The color scale represents the number of genes (in logarithmic scale) found for each KEGG entry. RJ (red) and BA (blue).

KEGG sub-pathway for starch and sucrose metabolism. The color scale represents the number of genes (in logarithmic scale) found for each KEGG entry. RJ (red) and BA (blue).