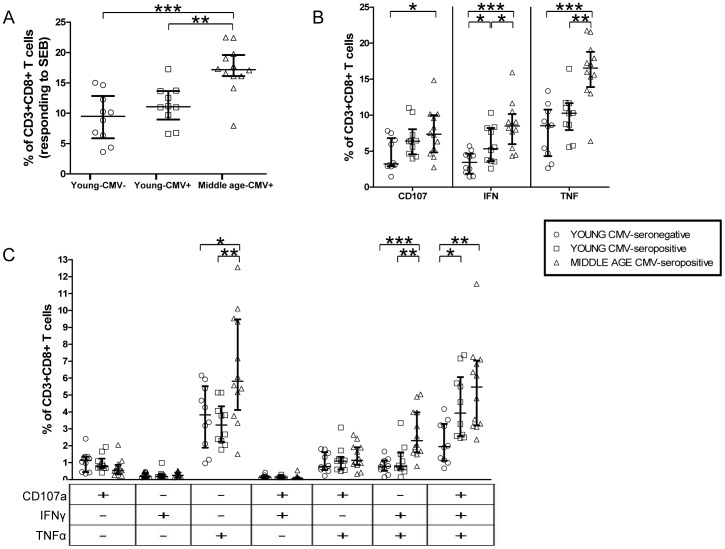
Figure 1. CD8+ T cells' responses to SEB stimulation, in healthy individuals stratified by CMV serostatus and age.
A) Percentage of CD3+CD8+ T cells that have any studied response to SEB. B) Total degranulation (CD107a) and cytokine production (IFN-gamma, TNF-alpha) by CD3+CD8+ T lymphocytes responding to SEB. Vertical black lines indicate interquartile ranges, ranging from the 25th to the 75th percentile. The median response for each category is indicated by a horizontal black line. C) Three-function analysis of SEB responses. Scatter graphs show the magnitude of SEB responses in each functional category, expressed as percentage of CD3+CD8+ T cells. The combination of functions studied is indicated in the table below the scatter graphs.

