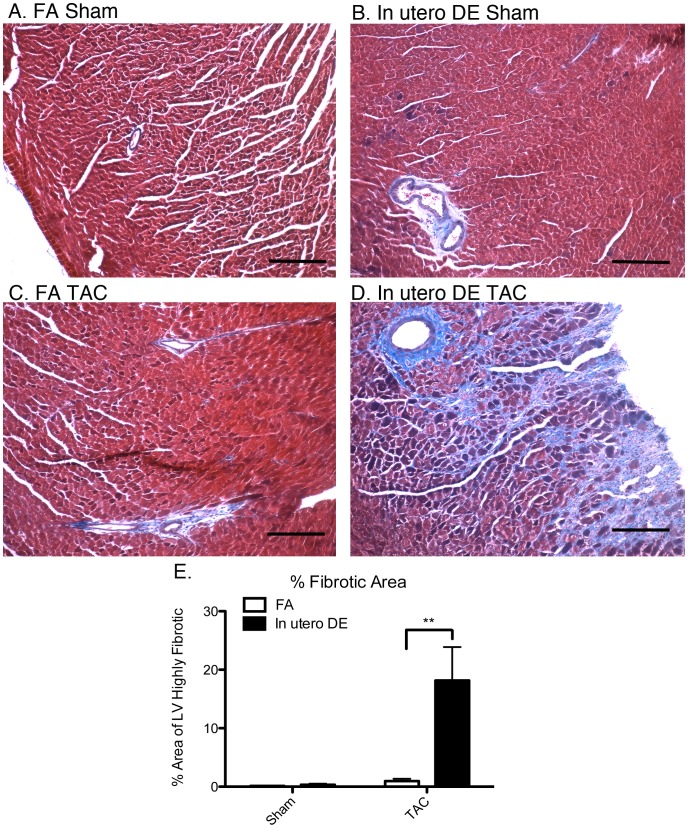
Figure 9. Assessment of myocardial fibrosis in the left ventricle wall of FA Sham (A), in utero DE Sham (B), FA TAC (C), and in utero DE TAC (D) mice.
Blue staining indicates fibrotic regions. Percentage of LV area that is highly fibrotic was quantified (E). FA sham (n = 4), FA TAC (n = 6), DE sham (n = 5), DE TAC (n = 6). Scale bars = 200 µm.

