
Fig. 4.
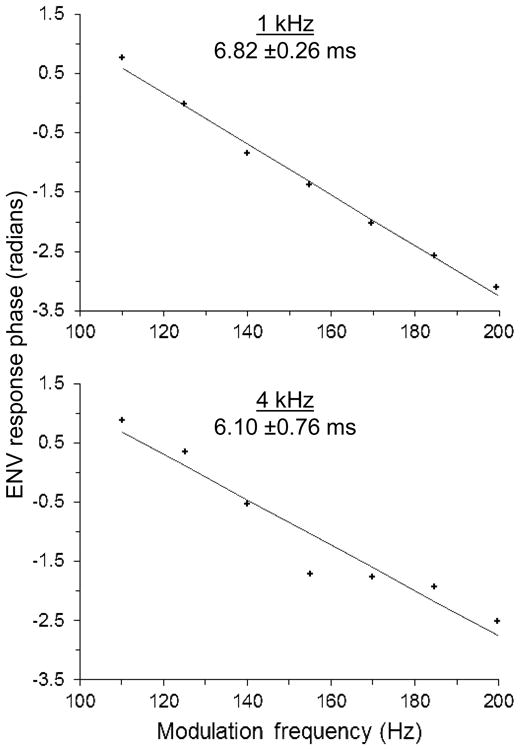
The phase of the ENV response in a single chinchilla as a function of the stimulus amplitude-modulation frequency. Stimulus carrier frequency is given at the top of each panel, followed by the estimate of the group delay (predicted mean and standard error). The group delay estimate was calculated from the slope of the linear regression (solid line).