
Fig. 6.
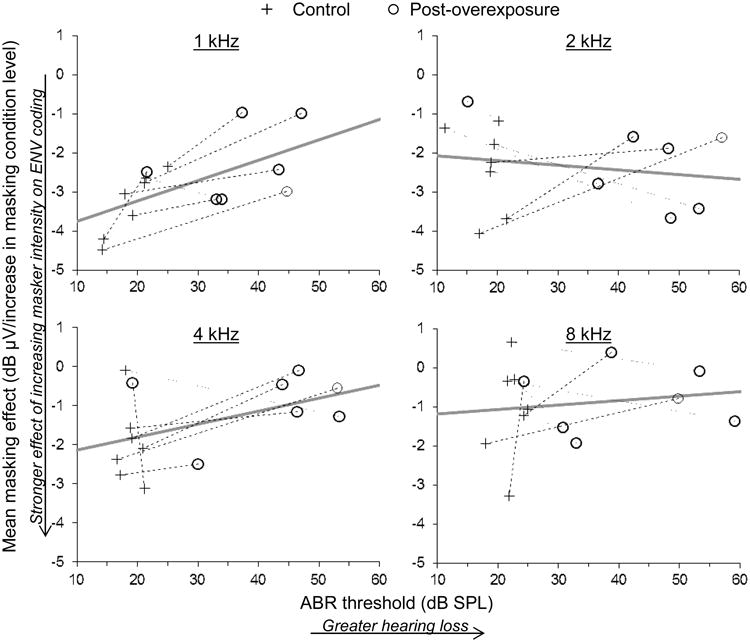
Mean change in ENV response amplitude per increase in masking condition level as a function of ABR threshold. More negative values along the vertical axis correspond to a stronger adverse effect of increasing masker intensity on ENV coding. Stimulus carrier frequency is given at the top of each panel. Dashed and dotted lines connect measurements made from the same animal with increasing and decreasing rates of change following acoustic overexposure, respectively. Thick gray lines show the predicted relationship from a repeated measures mixed model analysis (see text).