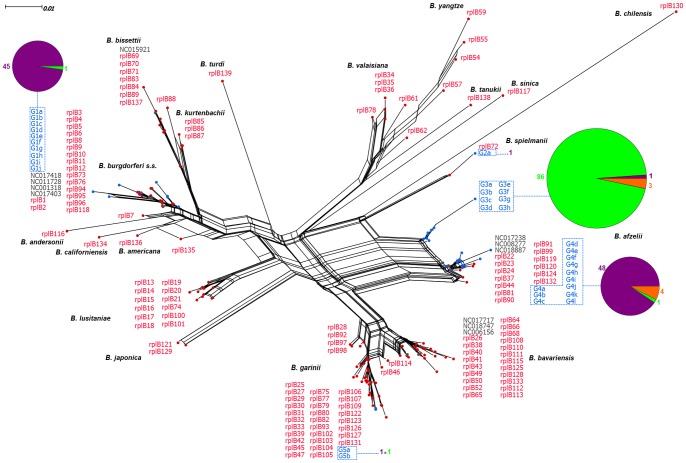
Figure 1. Phylogenetic network of rplB sequences.
The network includes consensus sequences of the genotypes recovered in this study (blue) as well as reference sequences for species in the Borrelia burgdorferi complex. The genotypes identified in this study formed empirically delineated genotype groups that are indicated with blue dotted lines. The pie charts connected to each main genotype group show the proportion of genotypes in the group that were isolated from each host species: Siberian chipmunks (purple), bank voles (green), or wood mice (orange).

