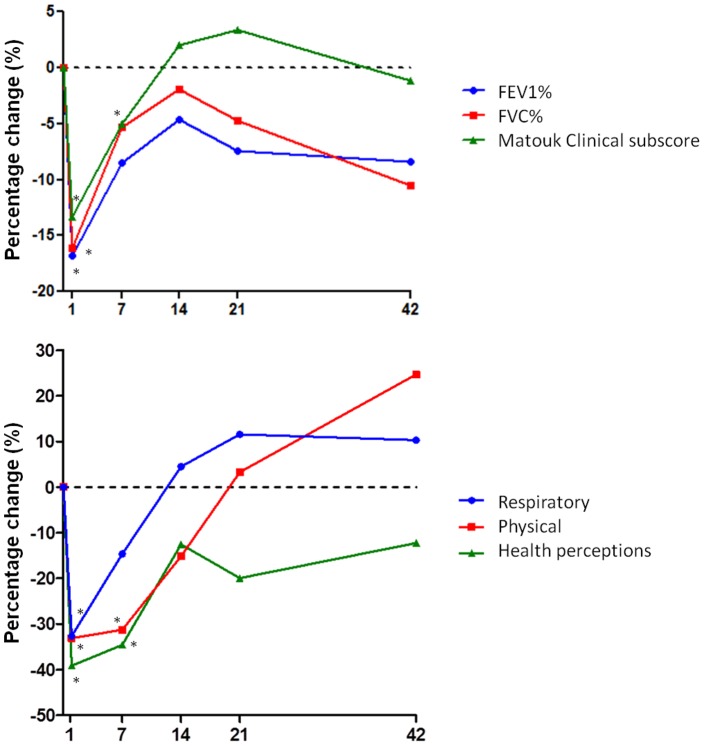
Figure 2. Percentage change of clinical and QOL parameters throughout PEs in CF.
A) FEV1% (blue, circles) and FVC% (red, squares) were significantly reduced from baseline values at Day 1 of PE (FEV1% p = 0.001; FVC% p = 0.010). Both parameters subsequently improved with treatment however, FVC% significantly declined at Day 42 (p = 0.028). The Clinical subscore of the Matouk Disease score (green, triangles) was significantly decreased from baseline values on Day 1 (p = 0.000) and Day 7 (p = 0.045). See Table S1 for the results of other Matouk Disease subscores. B) QOL items also decreased with PE onset, Day 1, such as Respiratory (blue, circles, p = 0.002), Physical (red, squares, p = 0.025) and Health Perceptions domains (green, triangles, p = 0.000). The Physical and Health Perceptions domains remained decreased at Day 7 (p = 0.025 and p = 0.001, respectively). Other QOL domains which decreased at Day 1 include: Vitality, Health Perceptions, Social and Role (Table S1). The dotted horizontal line indicates a 0% change or no change from baseline values. * indicates a significant difference from baseline. Day 1, n = 13; Day 7, n = 12, Day 14, n = 11; Day 21, n = 9; Day 42, n = 8. Full table of results can be found in Table S1.

