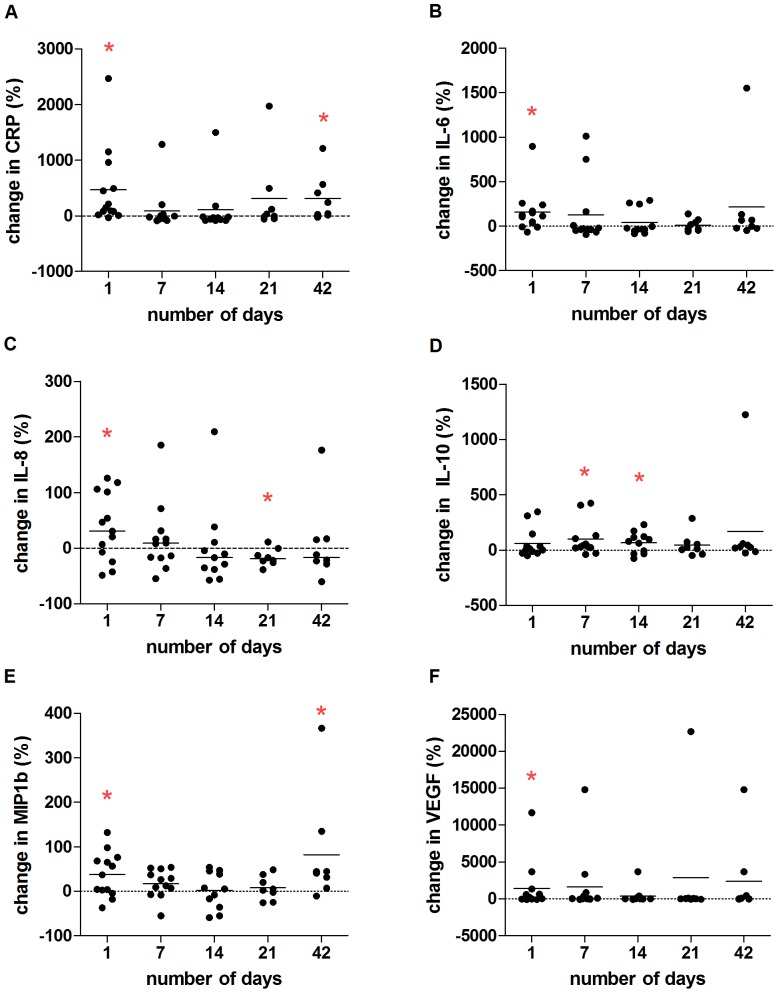
Figure 3. Percentage change in inflammatory markers throughout PEs in CF.
Inflammatory markers were measured in blood plasma from CF patients throughout PE. The percentage change was calculated at each time point and compared to a 0% change which indicates no change from baseline (represented by dotted horizontal line). A) CRP levels were significantly increased from baseline values on Day 1 of PE (p = 0.001) and Day 42 (p = 0.039). B) IL-6 levels were significantly higher on Day 1 of PE (p = 0.006). C) IL-8 concentrations were significantly higher on Day 1 (p = 0.047) and significantly lower than baseline values after treatment on Day 21 (p = 0.022). D) IL-10 levels rose significantly on Days 7 (p = 0.021) and Day 14 (p = 0.046). E) MIP-1β increased from baseline on Days 1 (p = 0.020) and Day 42 (p = 0.023). F) VEGF levels were significantly higher on Day 1 of PE (p = 0.043). Solid horizontal lines are set at the mean * indicates a significant difference from 0% change from baseline. Day 1, n = 13; Day 7, n = 12, Day 14, n = 11; Day 21, n = 9; Day 42, n = 8. Full data set is found in Table S2.

