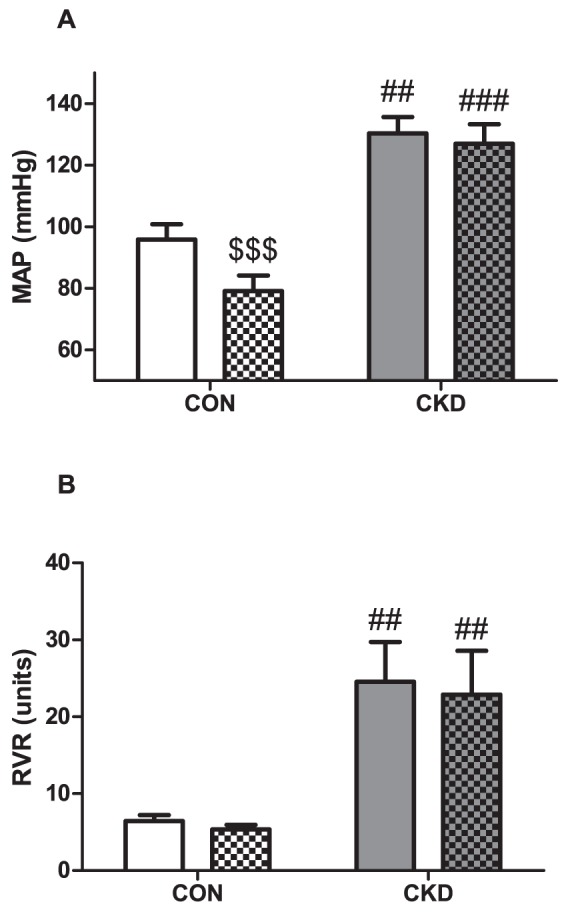
Figure 4. Mean arterial pressure (MAP) (panel A) and renal vascular resistance (RVR) (panel B) prior to baseline (plain bars) and during Tempol (bars with squares) in CON (n = 4, white bars) and CKD (n = 6, grey bars) rats.

Mean ± SEM. Two-way RM ANOVA (P CKD vs. CON = 0.001, P Tempol vs. baseline <0.001, P Interaction = 0,002 for panel A; P CKD vs. CON = 0.030, P Tempol vs. baseline = NS, P Interaction = NS for panel B), ## P<0.01, ### P<0.001 vs. CON. $$$ P<0.001 vs. baseline (paired observations).
