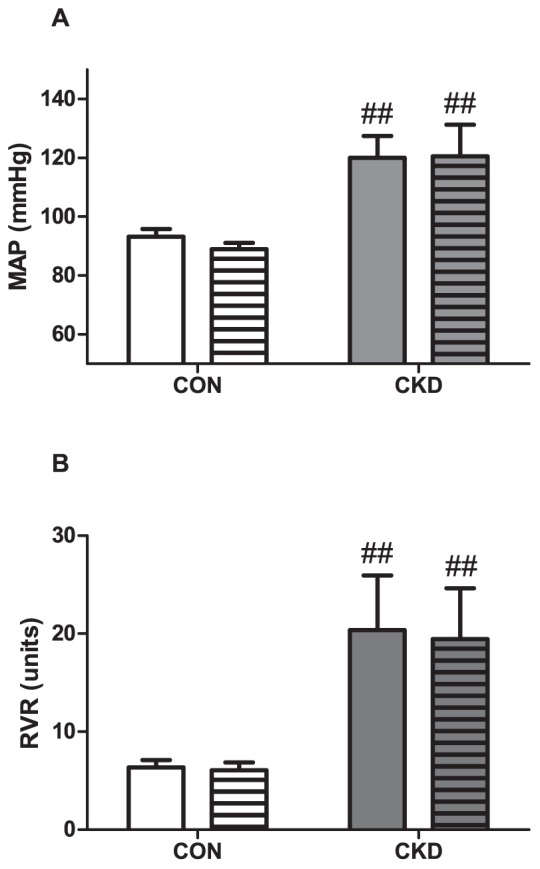
Figure 6. Mean arterial pressure (MAP) (panel A) and renal vascular resistance (RVR) (panel B) prior to baseline (plain bars) and during infusion of vehicle (bars with horizontal lines) in CON (n = 4, white bars) and CKD (n = 4, grey bars) rats.

Mean ± SEM. Two-way RM ANOVA (P CKD vs. CON = 0.020, P vehicle vs. baseline = NS, P Interaction = NS for panel A; P CKD vs. CON = 0.040, P vehicle vs. baseline = NS, P Interaction = NS for panel B). ## P<0.01 vs. CON.
