
Figure 7. Changes in MAP (panel A) and RVR (panel B) in CON (white bars) and CKD rats (grey bars) during infusion of Tempol (T, bars with squares), PEG-catalase (C, bars with stripes) and vehicle (V, bars with horizontal lines).
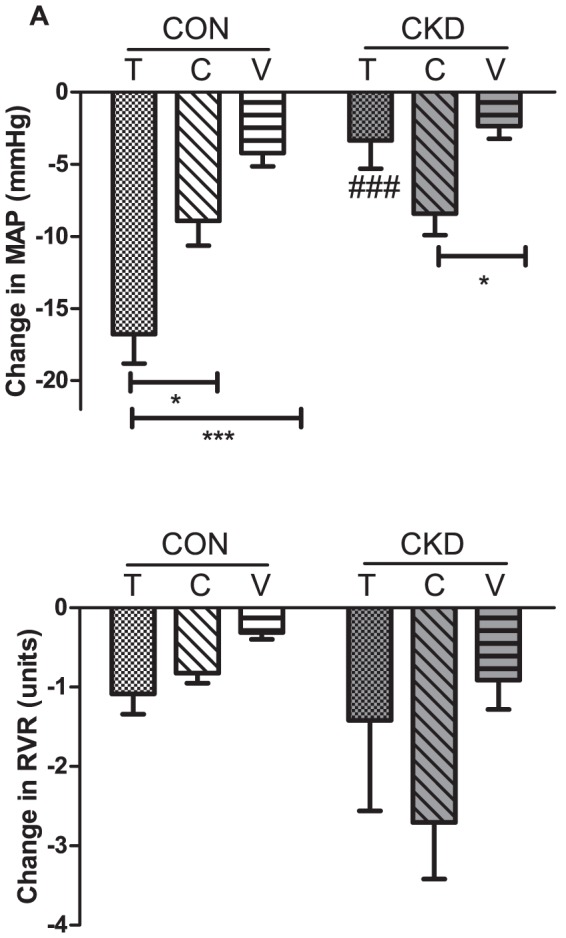
Mean ± SEM. P CKD vs. CON = 0.0011, P Interventions = 0.0028, P Interaction = 0.0014, for panel A; P CKD vs. CON = NS, P Interventions = NS, P Interaction = NS for panel B). Tukey post-hoc test for comparison between groups: ### P<0.01 vs. CON. Between groups: *P<0.05. **P<0.01 ***P<0.001.