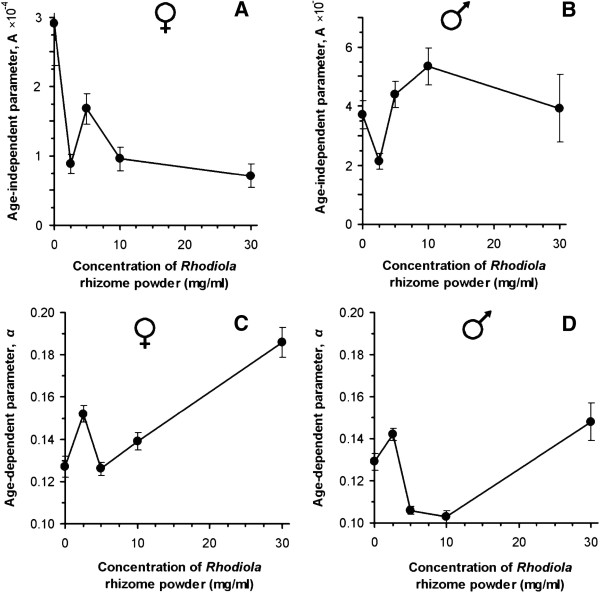
Figure 3.

Estimates of Gompertz equation parameters for the fly cohorts fed diets with different concentrations of R. rosea rhizome (A and C – A and α, respectively, for female cohorts, B and D – for male ones). Error bars show the standard error of the parameter. All fit values were reliable (P< 0.05 by Student’s t-test).
