
Figure 2.
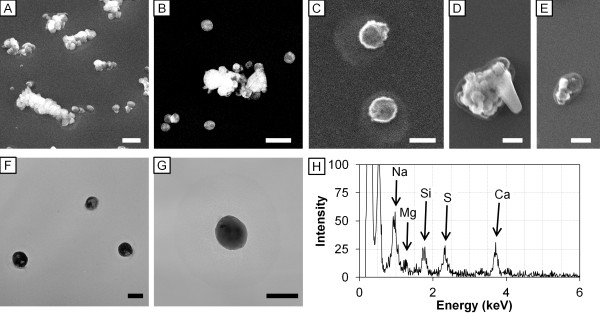
FE-SEM images, TEM images and EDS spectrum of particles released from ultrasonic humidifier. FE-SEM images of particles (0.5 − 2.5 μm) released from the humidifier with (A) tap water and (B) high-silica water under humidity 75%; particles (<0.5 μm) from the humidifier with tap water under (C) humidity 75% and (D, E) 99% are shown. TEM image of particles (<0.5 μm) from the humidifier with (F) tap water and (G) high-silica water under humidity 75%. Scale bars represent (A, B) 1 μm, (C, F, G) 200 nm, and (D, E) 500 nm. (H) EDS spectrum of the particle (C) is shown. The peaks of Na, Mg, Si, S, and Ca were detected at 0.97, 1.26, 1.78, 2.33, and 3.71 keV, respectively.