Figure 5.
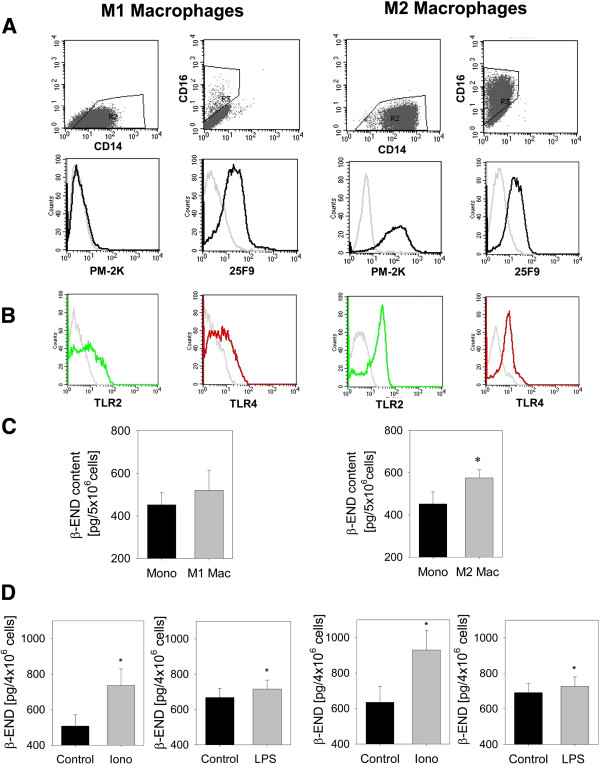
Content and release of β-END in macrophage differentiation. CD14+ monocytes were in vitro differentiated into M1 macrophages with GM-CSF (left column) and M2 macrophages with M-CSF and IL-10 (right column). Surface marker expression of CD16, CD14 as well as PM-2 K and 25 F9 as well as TLR2 and TLR4 were evaluated by flow cytometry. (A) Expression of CD16, CD14 as well as PM-2 K and 25 F9 on M1 and M2 macrophages as well as (B) TLR4 (red line) and TLR2 (green line). Representative examples were shown; isotype controls are depicted in grey lines (representative examples). (C) CD14+ monocytes (Mono) before differentiation and M1 and M2 macrophages (Mac) from the same individual after 6–7 d of culture were lysed and intracellular β-END content measured by ELISA (n = 14, * p < 0.05, paired t-test). (D) Release of β-END after incubation with 10 μM ionomycin (iono) or 10 μg/ml lipopolysaccharide (LPS) for 15 min from M1 and M2 macrophages was quantified in the supernatant (n = 21–24 for LPS and n = 7–8 for ionomycin, * p < 0.05, paired t-test). All data are presented as MEAN ± SEM.

