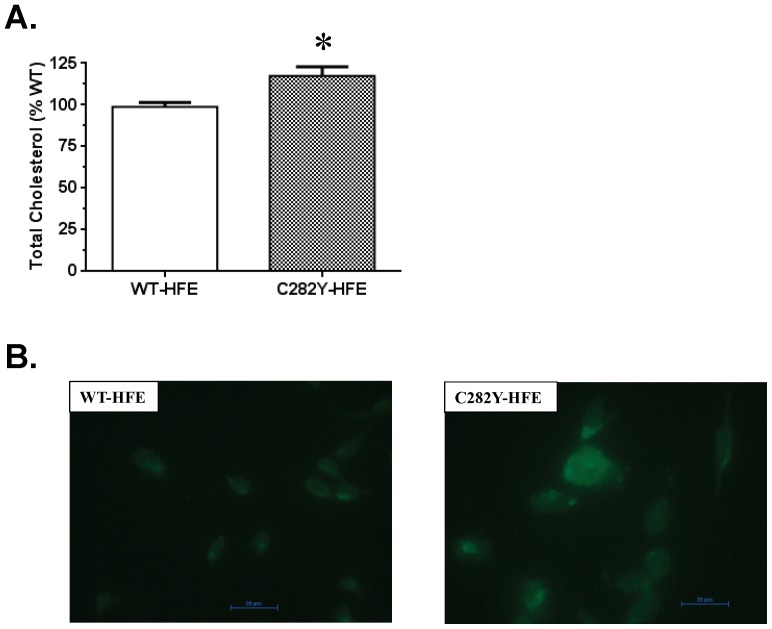
Figure 1. Cholesterol content in C282Y-HFE and WT-HFE stably transfected SH-SY5Y cells.
(A) Quantification of total cholesterol in SH-SY5Y cells expressing WT- or C282Y-HFE. Lipids were extracted from 106 cells and cholesterol content determined using a cholesterol quantification kit (Biovision). The cholesterol content in C282Y- HFE cells is indicated relative to that in WT-HFE cells. Data are displayed as means ± SEM. The asterisk (*) indicates a significant (p<0.05, n = 3) increase in cholesterol in C282Y-HFE cells relative to WT-HFE transfected controls. (B) Filipin staining of cholesterol. Cells (106 cells/sample) were cultured in a slide dish for 3 days prior to staining with 1% filipin and visualization using a Nikon Eclipse 80i microscope. Size bars indicate 20 µm.

