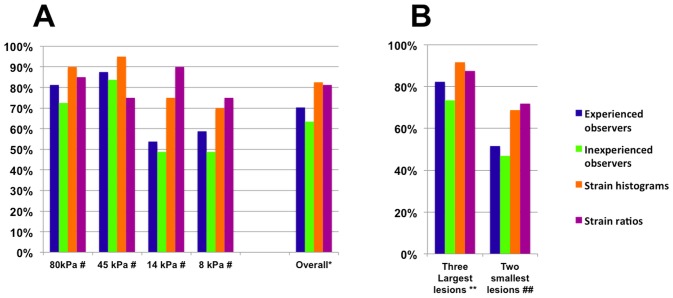
Figure 6. Percentages of Correctly Assessed Targets for Each Method Used.
6a. Percentages of correctly assessed targets of all diameters. For strain ratios and strain histograms 80 evaluations were performed. For visual scorings 640 observations were performed, 320 by experienced observers, 320 by inexperienced observers respectively. # The bars show mean percentage of correctly assessed targets for each level of target stiffness, with each method of evaluation. * Bars show the mean percentage of correctly assessed targets for all levels of target stiffness for each method of evaluation used. 6b. Percentages of correctly assessed small and large targets for each method. For strain ratios and strain histograms 80 evaluations were performed. For visual scorings 640 observations were performed, 320 by experienced observers, 320 by inexperienced observers respectively. ** Bars show the mean percentage of correctly assessed targets for the three largest diameters diameters (6.5, 10.4 and 16.7 mm). ## Bars show the mean percentage of correctly assessed targets for the two smallest diameters (2.5 and 4.1 mm).

