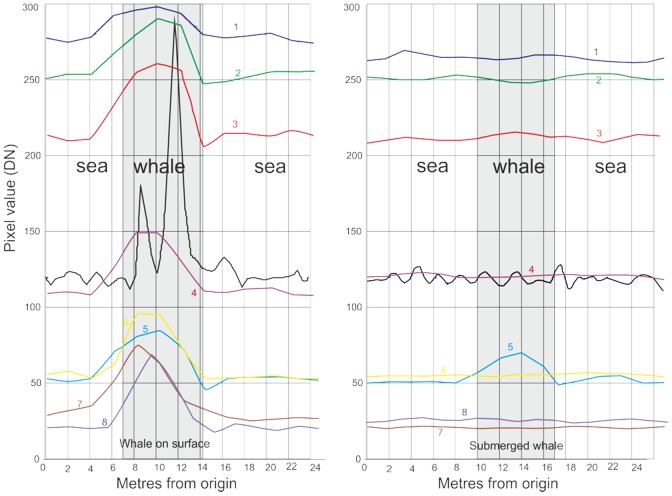
Figure 3. The sensor response through cross sections through two whale-like (correct shape and size) features assumed to be whales.
The left hand figure is from a feature at the surface, the right hand figure shows a submerged feature. Note that while all bands show the surface feature, only band 5 (the Coastal Band) identifies the submerged feature.

