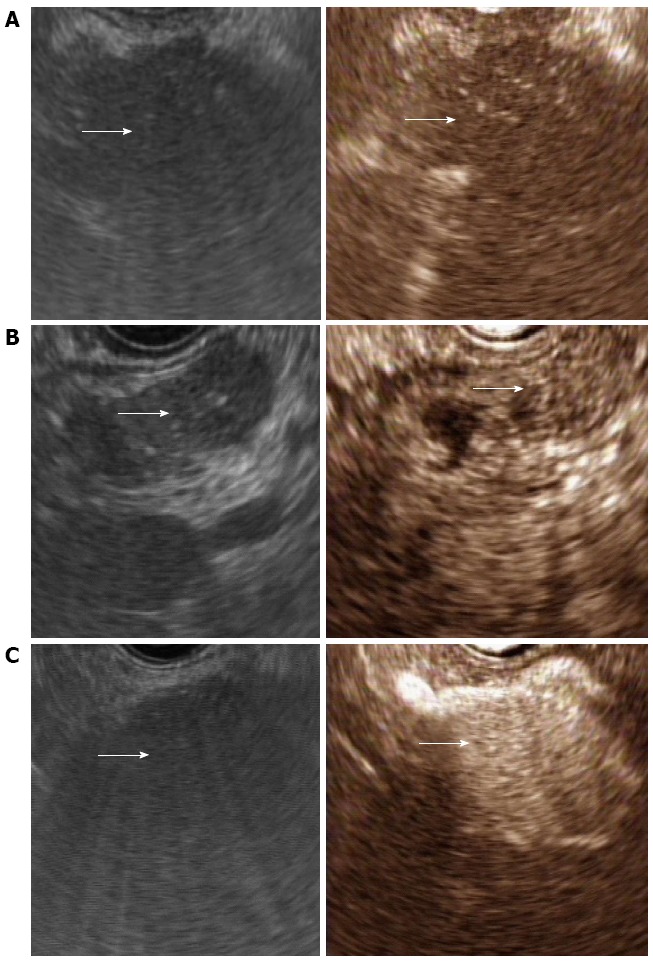
Figure 1.

Conventional endoscopic ultrasonography (left) and contrast-enhanced harmonic endoscopic ultrasonography (right). These pictures showed a typical example of a hypoenhancement pattern (A), an isoenhancement pattern (B), and hyperenhancement pattern (C).
