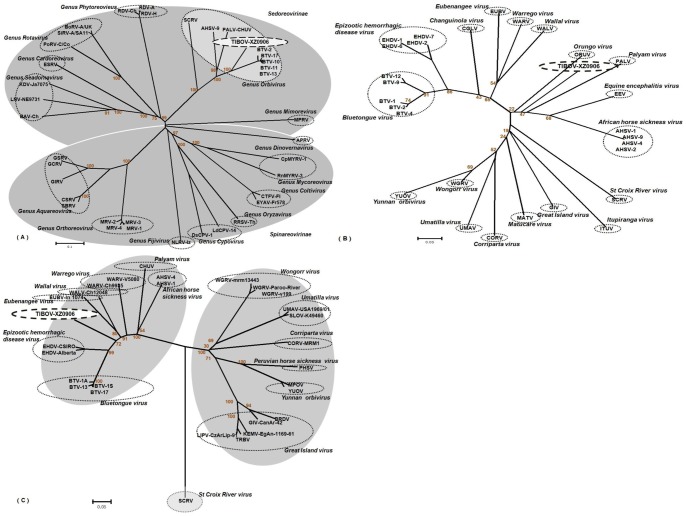
Figure 5. Phylogenetic analysis of VP1 amino acid sequences from (A) Reoviridae and (B) Orbivirus strains.
(C) Phylogenetic analysis of T2 amino acid sequences from 29 Orbivirus strains. These analysis employed a neighbor-joining method (using the P-distance algorithm) using the MEGA version 5.04 software package (www.megasoftware.net). Bootstrap probabilities for each node were calculated using 1000 replicates. Scale bars indicate the number of amino acids substitutions per site. In Figure 5(C), as many of the available sequences are incomplete, analysis is based on partial sequences (residues 356-567 relative to the BTV-1A sequence). Abbreviations and serotypes (or strain name) are shown in the radial tree image of Figure 5. GenBank accession numbers and further details of the sequences can be found in Table 2.

