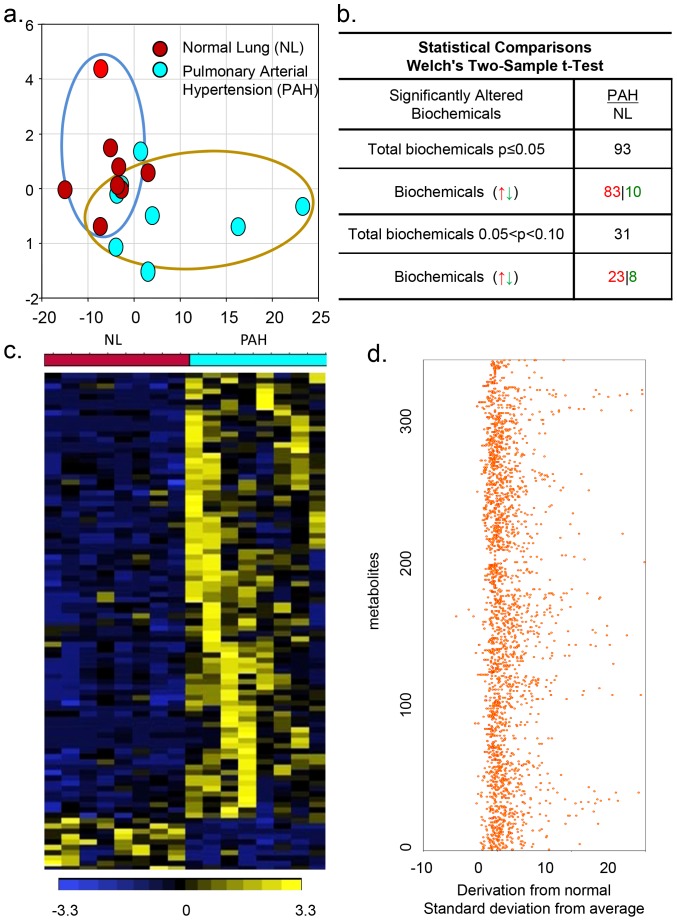
Figure 1. Metabolomic profiling of pulmonary hypertension.
a), Principal component analysis (PCA) for metabolom PAH tissue exhibited a distinct metabolic signature in comparison to NL. b), Statistical comparisons using Welch's Two-Sample t-Test show significantly altered biochemicals in PAH samples (N = 8) compared with biochemical profiling in normal samples (N = 8). Interestingly, the biochemical profiles of PAH tissue exhibited higher levels of 93 altered metabolites compared with the normal lung (p≤0.05). c), Heat map that represents the non-supervised hierarchical clustering of 93 differential metabolites in PCA relative to normal sample data over eight PAH lungs (n = 8). Shades of light yellow/blue represent the increase and decrease of a metabolite, respectively, relative to the median metabolite levels. d) z-score plots show the 376 metabolites data that were normalized to the mean of the normal samples (truncated at 25).

