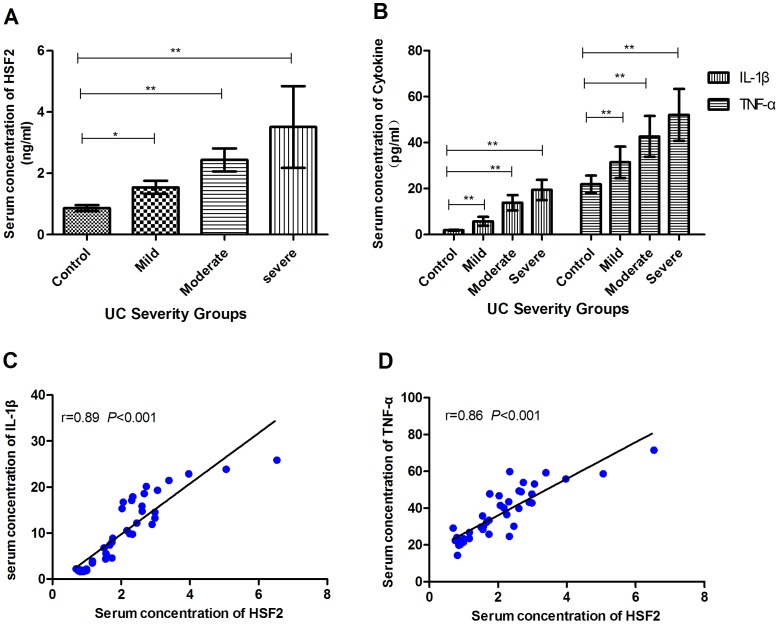
Figure 5. The concentration of HSF2, IL-1β and TNF-α in serum was determined by ELISA.
A: serum concentration of HSF2 in patients with UC of varying severity. B: serum concentrations of IL-1β and TNF-α of different UC severity groups. C: Correlation analysis between the concentrations of HSF2 and IL-1β. D: Correlation analysis between the concentrations of HSF2 and TNF-α.Correlation analysis was assessed using the Pearson Test which gives a correlation coefficient (Pearson “r”) and a “p” value. *, p<0.05; **, p<0.01.

