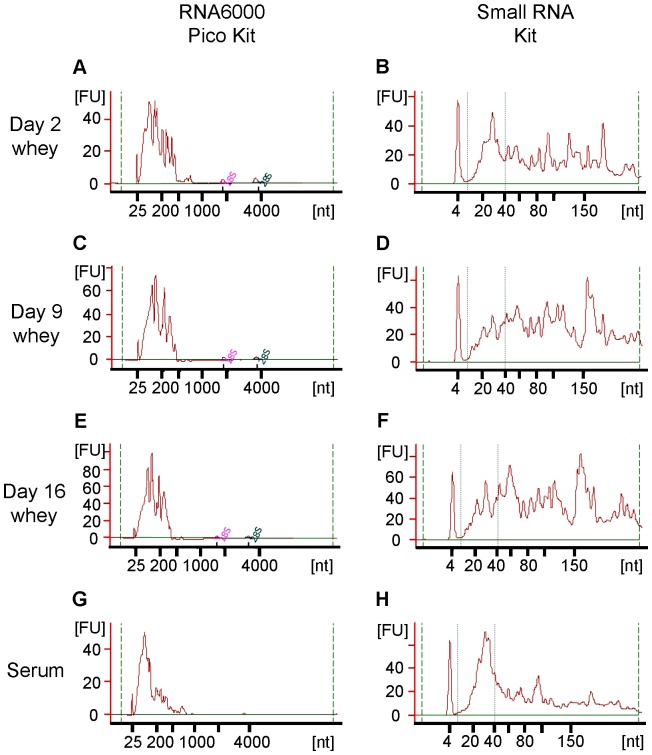
Figure 1. Bioanalyzer analysis of RNAs in rat whey and serum.
(A, B) Day 2 whey; (C, D) Day 9 whey; (E, F) Day 16 whey; (G, H) Serum; (A, C, E, G) Analysis using the RNA 6000 Pico Kit; (B, D, F, H) Analysis using the Small RNA Kit. Whey RNA concentrations were very high (especially in day 2 whey), so diluted RNA results are shown in this figure. FU = fluorescence units.

