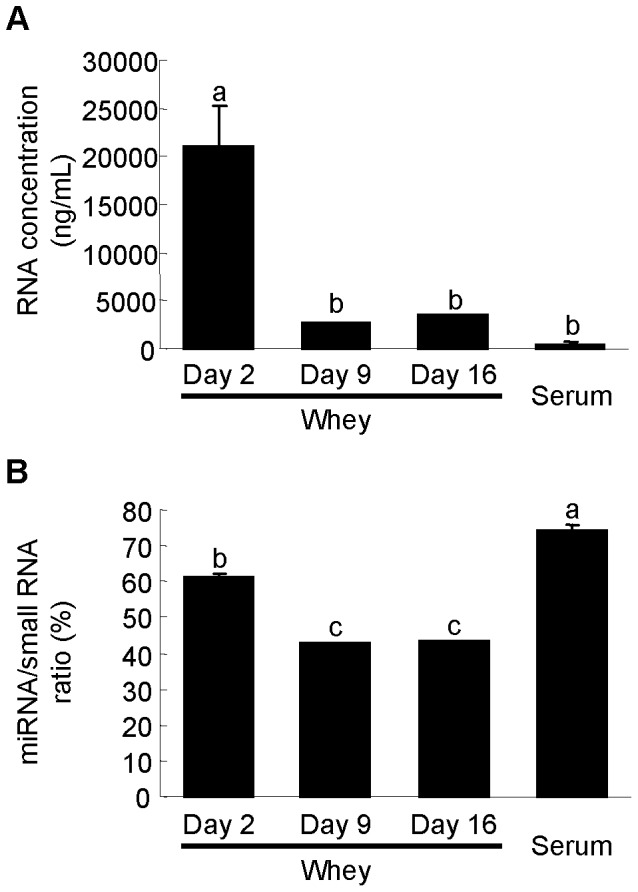
Figure 2. RNA concentration and miRNA/small RNA ratio of RNA samples purified from rat whey and serum.

(A) RNA concentrations in rat milk whey and serum. (B) miRNA/small RNA ratio; Values are the mean ± SEM (n = 3). Means without letters in common differ (P<0.05, Tukey-Kramer HSD test).
