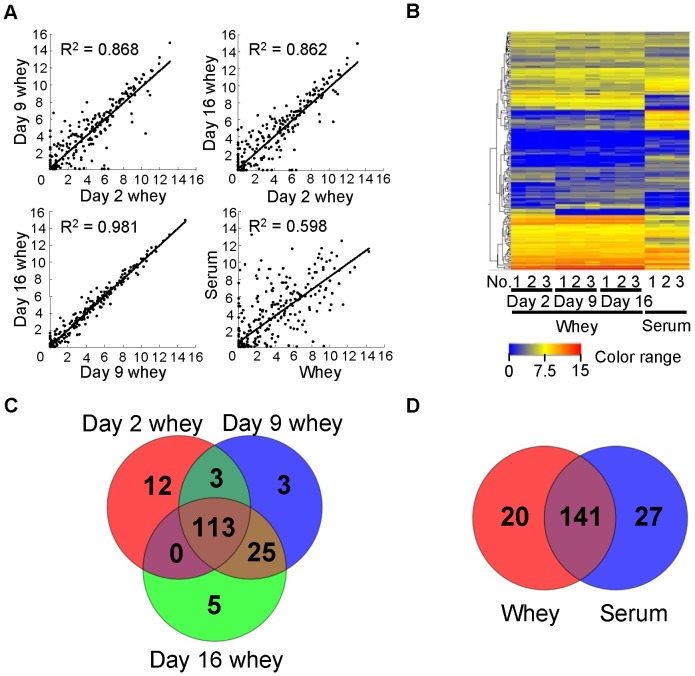
Figure 3. miRNA microarray profiles of rat whey and serum.
(A) Scatter plots of averaged whey and serum array data. (B) Heat map of the normalized array data for miRNAs detected in whey or serum samples. (C) Venn diagram of numbers of miRNAs detected in each type of whey. (D) Venn diagram of numbers of miRNAs detected in whey and serum. Detailed signal intensities in heat map and miRNA species in Venn diagram are shown in Table S3.

