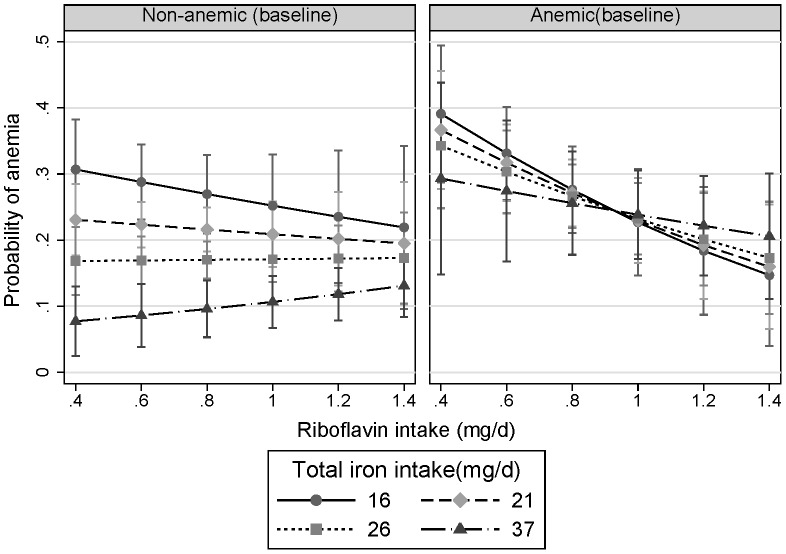
Figure 2. Interaction between riboflavin intake and iron intake at baseline in relation to anemia at follow up stratified by anemia status at baseline.
Marginsplot syntax was used to make the plot after logistic regression adjusting for age, gender, smoking, energy intake, dietary patterns (continuous), education, income, BMI, and hypertension at baseline. The values represent the adjusted probability of anemia at follow-up. The values of iron intake represent the median intake in each quartile of iron intake. P value for interaction between riboflavin intake and iron intake was 0.008.

