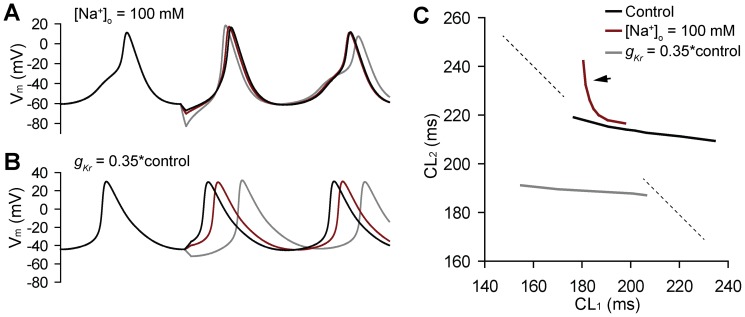
Figure 2. The cycle length restitution curve.
(A–B) Simulated spontaneous action potentials during a protocol to determine the cycle length restitution curve. A 10-ms stimulus is applied with varying amplitude at the maximum diastolic potential to accelerate or delay the subsequent spontaneous action potential. Time between 2nd and 1st APs following perturbation (CL2) is then plotted as a function of time between 1st perturbed and steady-state APs (CL1). (C) CL restitution curves for control (black), low [Na+]o (red) and IKr block (gray). Note that low [Na+]o results in a curve with an abrupt transition from a relatively flat region to a very steep region (maximal slope >>−1 indicated by arrow; dashed line has slope of −1 for reference).

