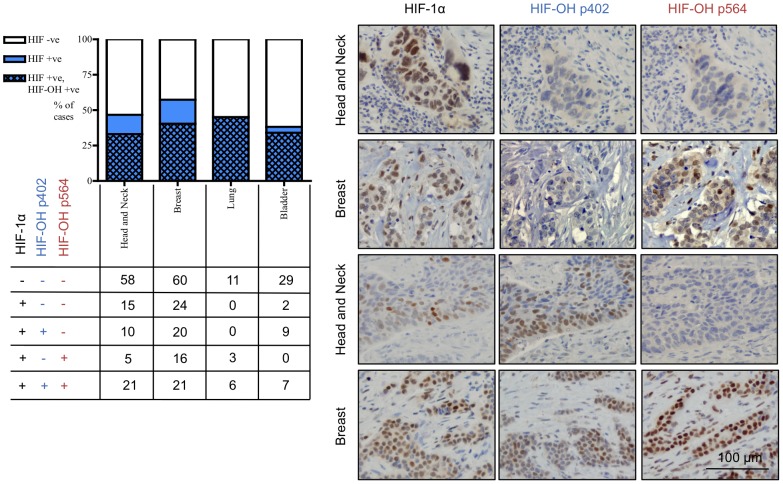
Figure 4. Proline-hydroxylated HIF-1α is present in a high proportion and wide range of tumours.
Graph indicates relative proportion of HIF-1α positive tumours, and the proportion of which also show detectable staining for proline-hydroxylated HIF-1α. Numbers below represent numbers of cases with that particular staining pattern. Photomicrographs representative of cases showing different patterns of expression of proline-hydroxylated HIF-1α. Scale bar (bottom right) applies to all images.

