
Fig. 3.
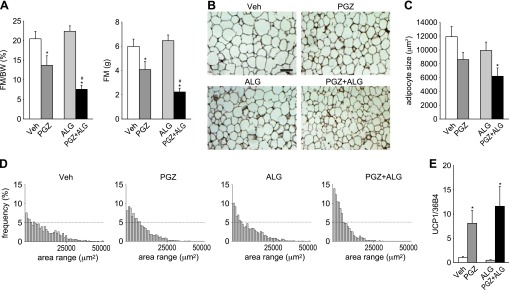
Fat mass (FM) reduction explained the prevention of PGZ-induced BW gain by ALG. A: bioimpedance analysis of FM after 14-day treatment with PGZ, ALG, and PGZ + ALG. Left: FM relative to BW; right: absolute values. *P < 0.05 vs. Veh; #P < 0.05 vs. PGZ alone; n = 9–10/group. B: hematoxylin and eosin staining of epididymal white adipose tissue (WAT). Scale bar, 200 μm. C and D: quantification (C) and histogram (D) of adipose cell cross-sectional area after 14-day treatment with PGZ, ALG, and PGZ + ALG. E: PGZ increases epididymal WAT mRNA expression of uncoupling protein 1 (UCP1). *P < 0.05 vs. Veh; n = 4–5/group.