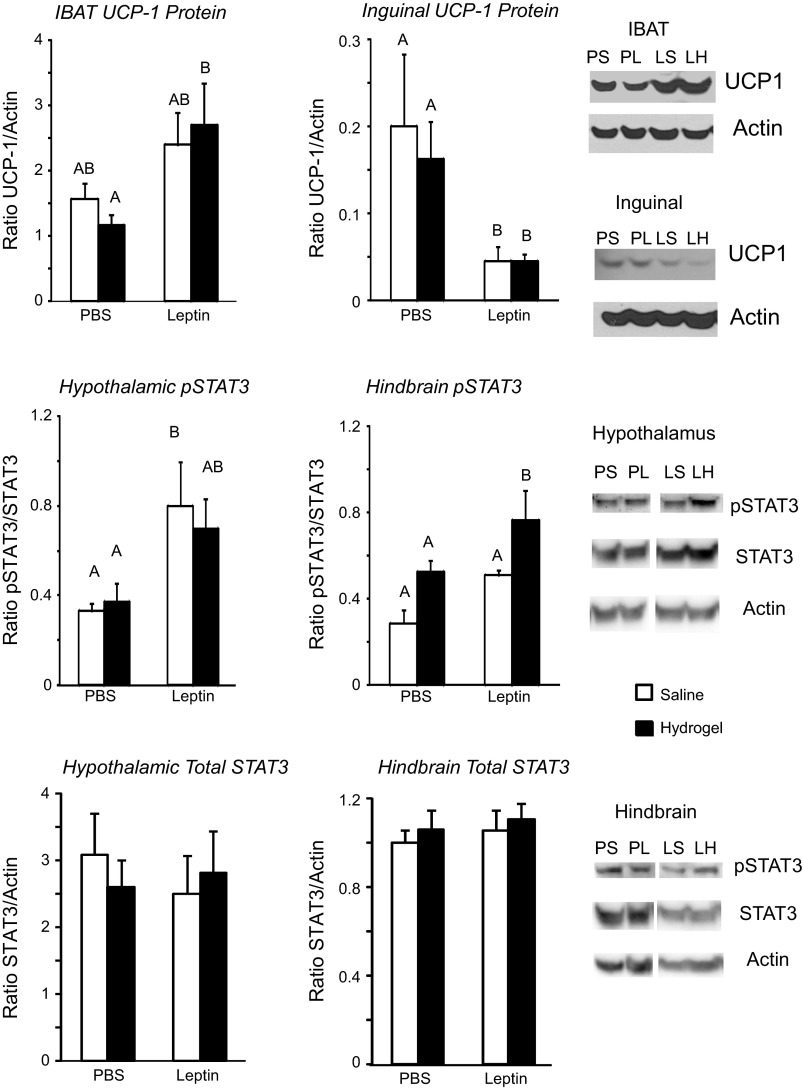
Fig. 3.
Top: uncoupling protein 1 (UCP1) protein expressed as a ratio to actin in intrascapular brown fat (IBAT) and inguinal white fat collected at the end of the experiment. Middle: phosphorylated STAT3 (p-STAT3) in hypothalamic and hindbrain tissue blocks expressed as a ratio to total STAT3. Bottom: total STAT3 in hypothalamic and hindbrain tissue blocks expressed as a ratio to actin. Data are means + SE for groups of 7–9 rats. Values on a specific axis that do not share the same letter are significantly different at P < 0.05. PS, PBS-saline; PH, PBS-hydrogel; LS, leptin-saline; LH, leptin-hydrogel.

